Deep Review of Bit浪浪's 4,000+ Trades: The Truth Behind a Top Trader's Wealth Lies in the Profit and Loss Distribution
Recently, I used the data mining feature of 'Langlang Lab' to review over 4,000 real trades by top trader Bit浪浪 over a period of time.
Many friends have said they don't know what to look at when faced with thousands of rows of data. In fact, when you turn this cold data into a 'profit and loss distribution chart,' you'll discover a mind-blowing truth: A top trader's success isn't about being right more often than you, but about 'cutting losses and letting profits run.'
Here are three core findings from my data analysis.
1. The Myth of Win Rate Shattered: 60% of the Time He's Losing
In many people's imagination, a top trader should be an 'ever-victorious general,' entering every trade with precision. But look at this truncated profit distribution chart:
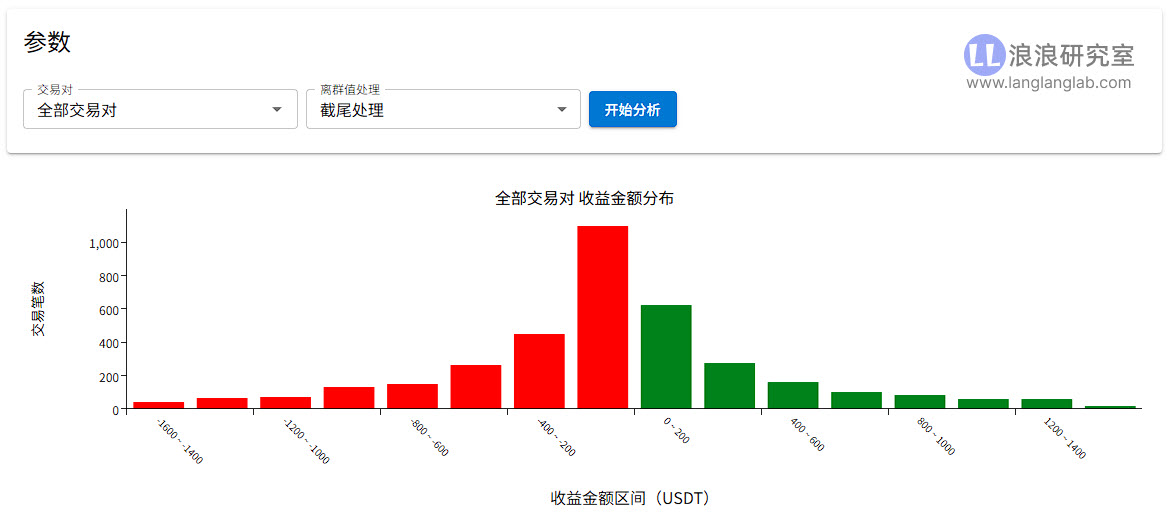
Through data statistics, we found:
- Losing trades: about 2,278
- Winning trades: about 1,387
- True win rate: only about 38%
Seeing this, you should breathe a sigh of relief. Even a top player like Bit浪浪 loses money 6 out of 10 trades. If you doubt life after a few consecutive stop-losses and even start holding losing positions, it means you haven't crossed the first threshold of professional trading.
2. The Art of Stop-Loss: The Man-Made 'Cliff'
Please look carefully at the distribution on the left side (red area) of the chart. You'll notice a very interesting phenomenon: The number of losses within -200 USDT is the highest (up to 1,098 trades), and as the loss amount increases, the bars quickly shorten, forming a steep cliff.
This means:
- Extremely strong protection mechanism: Bit浪浪 does not reject stop-losses; he treats them as naturally as breathing.
- Never holds losing positions: When entering each trade, he has a firm red line in mind. Once the market proves him wrong, he immediately cuts the loss and never lets a trade slide into an uncontrollable abyss.
3. The Truth of Huge Profits: Catching That 1% 'Black Swan' Profit
If Figure 1 shows 'defense,' then Figure 2 shows 'offense.' When we put back those truncated outliers (large profits), you'll see a completely different picture:
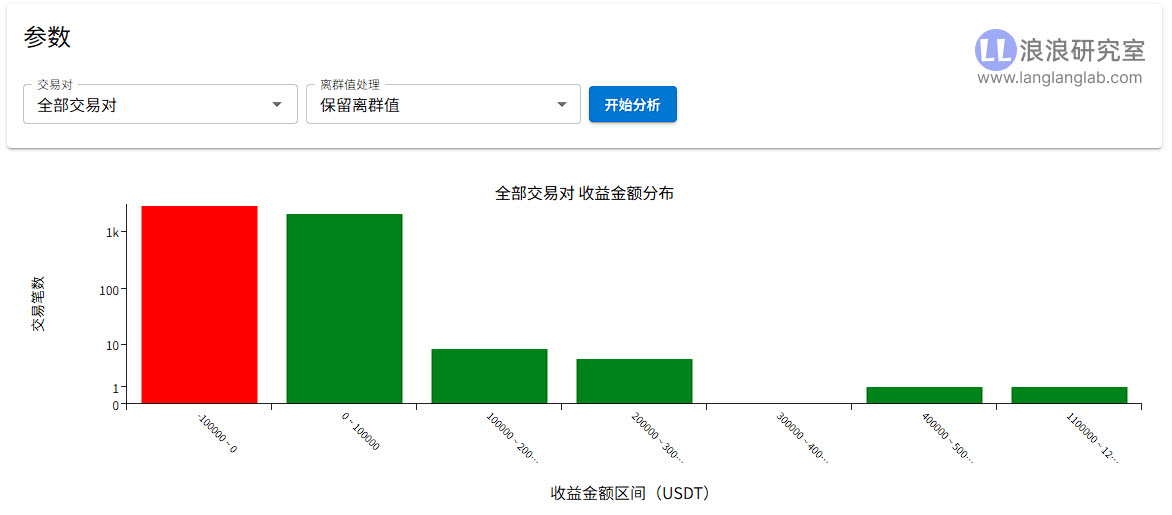
Two shocking details are hidden in the data:
- Among the 4,000+ trades, the vast majority are small wins and small losses.
- But one trade made over $1.1 million in profit, and about a dozen trades made between $100,000 and $300,000.
This $1.1 million huge profit is enough to cover his previous hundreds or even thousands of small stop-losses.
4. Conclusion
So, true huge profits aren't accumulated by diligently 'scalping,' but by daring to trial and error at low cost in exchange for that one or two opportunities to catch a 'super trend.' When the market moves in his favor, his ability to hold the trade is astonishing, until he squeezes out every last bit of profit.
In the top trader's 4,000+ trades, what else have you discovered? Welcome to try your own filtering logic in 'Langlang Lab.'